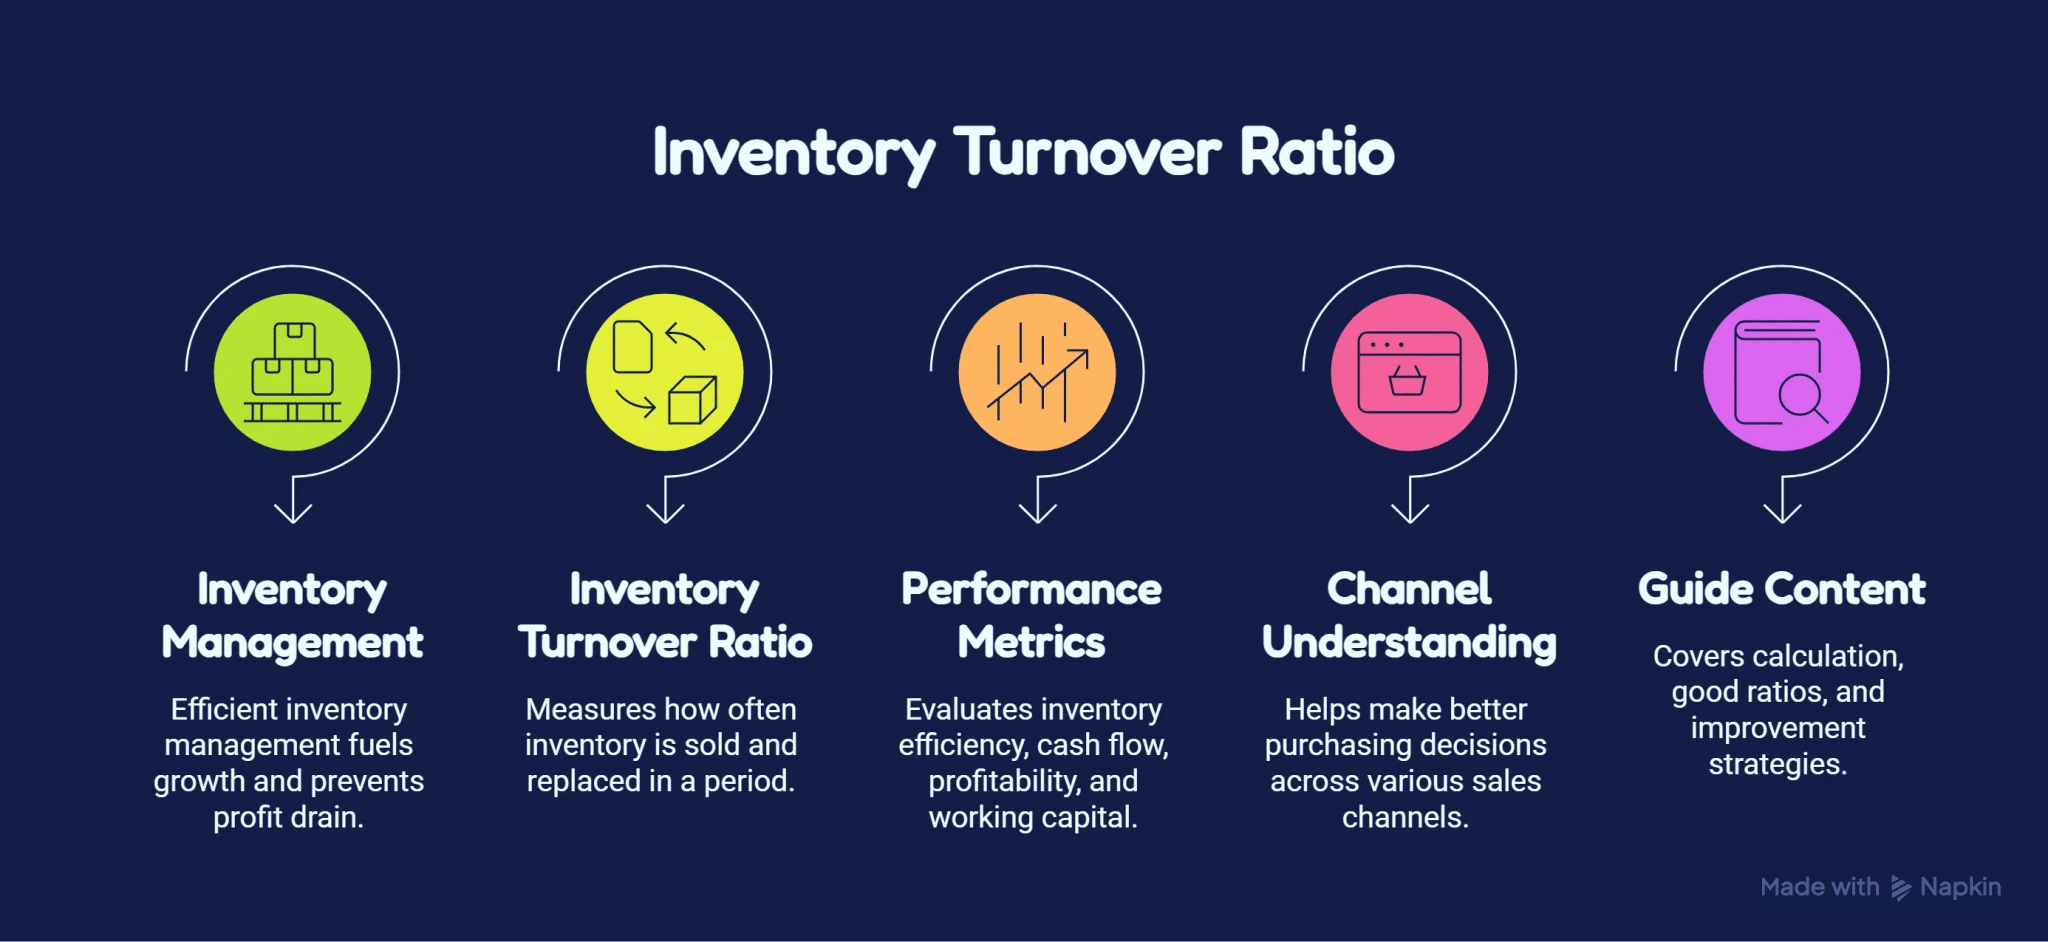
Inventory can either fuel growth or quietly drain profit. Many businesses focus on increasing sales but overlook how efficiently inventory moves through the business. Products sitting too long on warehouse shelves tie up cash, increase storage costs, and raise the risk of dead stock. Inventory that moves too quickly can create stockouts, missed sales, and unhappy customers.
This is where inventory turnover ratio becomes important.
Inventory turnover ratio measures how often a business sells and replaces its inventory during a specific period. It’s one of the most widely used inventory performance metrics because it helps businesses evaluate inventory efficiency, cash flow management, profitability, and working capital utilization.
Whether you sell through Amazon Seller Central, Shopify, eBay, Walmart Marketplace, Etsy, WooCommerce, or a combination of channels, understanding inventory turnover helps you make better purchasing decisions, improve inventory planning, and maintain healthier stock levels.
In this guide, you’ll learn what inventory turnover ratio is, how to calculate it, what a good inventory turnover ratio looks like across industries, and how businesses use it to improve inventory performance.

What Is Inventory Turnover Ratio?
Inventory turnover ratio measures how efficiently a business sells and replenishes inventory during a specific accounting period. It compares Cost of Goods Sold (COGS) against Average Inventory to determine how many times inventory is sold and replaced over a given timeframe, a concept widely used in financial analysis and explained in detail by
Investopedia.
A higher inventory turnover ratio often indicates strong sales and effective inventory management. A lower ratio may suggest overstocking, slow moving inventory, weak demand, or purchasing inefficiencies.
For ecommerce businesses, retailers, wholesalers, and manufacturers, inventory turnover serves as a critical indicator of inventory health and operational efficiency, touching cash flow, working capital, demand planning, and replenishment decisions all at once.
Inventory Turnover Ratio Formula (How to Calculate It)
The Formula
Inventory Turnover Ratio = Cost of Goods Sold (COGS) ÷ Average Inventory
- Cost of Goods Sold (COGS) refers to the direct costs associated with producing or purchasing the products sold during a period.
- Average Inventory represents the average value of inventory held during that same period.
Average Inventory = (Beginning Inventory + Ending Inventory) ÷ 2
Using average inventory smooths out fluctuations that occur throughout the year. A retailer that significantly increases inventory before the holiday season would get a distorted turnover figure from a single month’s balance. Averaging gives a more accurate picture.
Step by Step Calculation Example
Assume a business reports:
- Annual COGS: $600,000
- Beginning Inventory: $80,000
- Ending Inventory: $120,000
Step 1, Average Inventory: ($80,000 + $120,000) ÷ 2 =
$100,000
Step 2, Apply the formula: $600,000 ÷ $100,000 =
6
The business sold and replenished its inventory six times during the year. Whether six is “good” depends on the industry, product category, customer demand, and inventory strategy, covered in the benchmarks section below.
Can You Calculate It Without COGS?
COGS is the preferred metric because it reflects the actual cost of inventory sold. Some businesses substitute sales revenue when COGS data is unavailable, but this is generally less accurate. Revenue includes markup and gross profit, which distorts the result. Use COGS whenever possible.
How to Calculate Days Inventory Outstanding (DIO)
Inventory turnover ratio shows how many
times inventory is sold during a period. Days Inventory Outstanding (DIO) measures how
long inventory remains in stock before being sold.
DIO = 365 ÷ Inventory Turnover Ratio
Using the example above: 365 ÷ 6 =
60.8 days. The business holds inventory for roughly 61 days before selling it. A lower DIO generally indicates faster inventory movement, while a higher DIO can point to overstocking, slow moving inventory, weak demand, or inventory planning issues. Most businesses track DIO and inventory turnover ratio together for a fuller picture.

What Does Your Inventory Turnover Ratio Tell You?
Inventory turnover ratio shows how effectively inventory is being converted into revenue. Purchasing decisions, demand forecasting accuracy, cash flow management, and how well inventory investment is being used all show up in this one number. A healthy ratio generally means inventory is moving at a pace aligned with customer demand; a poor ratio suggests inventory is accumulating faster than it’s being sold.
Inventory and cash flow. Inventory represents cash that has already been spent. The longer it sits in storage, the longer that cash stays tied up instead of funding purchasing, marketing, hiring, or growth. This is one reason investors and lenders watch turnover closely.
Inventory and profitability. Businesses carrying excessive inventory face higher storage costs, increased insurance expense, obsolescence risk, write offs, and discounting pressure, all of which erode margin even when the product eventually sells.
Is a Higher Inventory Turnover Ratio Always Better?
A higher ratio is usually viewed positively because it suggests products are selling efficiently: stronger sales performance, lower carrying costs, better cash flow, less dead stock risk. But it isn’t always better. Extremely high turnover can signal understocking, insufficient safety stock, frequent stockouts, and lost sales. A business that repeatedly runs out of inventory can post a high turnover ratio while still losing revenue to poor availability. The goal isn’t maximizing turnover; it’s balancing availability with efficiency.
| High Inventory Turnover |
Low Inventory Turnover |
| Strong inventory movement |
Slow inventory movement |
| Better cash flow |
Cash tied up in stock |
| Lower carrying costs |
Higher storage expenses |
| Reduced dead stock risk |
Greater dead stock risk |
| Improved inventory efficiency |
Overstocking concerns |
| Faster replenishment cycles |
Slower inventory cycles |
Neither extreme is ideal. The best inventory turnover ratio depends on industry conditions, demand patterns, lead times, and inventory strategy.
What Is a Good Inventory Turnover Ratio? (Benchmarks by Industry)
There’s no universal benchmark that applies to every business. A grocery retailer, electronics distributor, apparel brand, and manufacturer all operate under very different inventory conditions. As a general guideline, a ratio below 2 may indicate slow movement, 4 to 8 is often considered healthy for retail and ecommerce, and above 10 is common in grocery and fast moving consumer goods, broadly consistent with benchmarking guidance from organizations like the
Business Development Bank of Canada and
Oracle NetSuite.
| Industry |
Typical Inventory Turnover Range |
| Grocery & Perishable Goods |
10 to 15+ |
| Retail |
4 to 8 |
| Ecommerce |
4 to 8 |
| Fashion & Apparel |
3 to 6 |
| Electronics |
5 to 10 |
| Manufacturing |
2 to 6 |
These ranges vary by product mix, seasonality, demand volatility, and supply chain conditions. The most useful benchmark is comparing your ratio against businesses in your own industry rather than against a generic, cross industry number. Product lifecycles, demand patterns, and replenishment cycles differ too much for a single figure to mean the same thing everywhere.
Why Inventory Turnover Ratio Matters for Your Business
Inventory turnover ratio is more than an accounting metric. It directly affects cash flow, profitability, inventory costs, and long term growth. Every product sitting on a shelf represents money already spent; until it’s sold, the business can’t recover that investment or redeploy the capital elsewhere.
A healthy ratio helps businesses improve cash flow, reduce carrying costs, lower storage expense, minimize dead stock, strengthen forecasting, and support faster replenishment. Businesses with poor turnover often struggle with excess inventory, cash flow constraints, and rising warehouse costs, and according to the
Corporate Finance Institute, turnover is one of the efficiency ratios analysts use most often to assess how well a company manages its assets.
On inventory costs specifically: holding inventory is expensive. Storage fees, warehouse space, insurance, handling, shrinkage, and obsolescence all increase the longer inventory sits unsold. This is why businesses focus on improving inventory
efficiency rather than simply carrying more stock.
What Affects Your Inventory Turnover Ratio?
Several factors drive turnover up or down, and understanding them helps you identify where to focus improvement efforts:
- Demand volatility: shifts in consumer behavior, economic conditions, or market trends can spike or stall inventory movement unexpectedly.
- Seasonality: holiday periods, back to school season, and weather driven categories distort turnover if you don’t account for the pattern.
- Pricing strategy: products priced too high sell slowly; priced too low, they move faster but erode margin.
- Supplier lead times: long lead times require higher safety stock; shorter lead times improve flexibility and reduce inventory investment.
- Marketing and promotions: successful campaigns increase demand and movement, but poor forecasting during a promotion can also trigger stockouts.
- Product lifecycle stage: new products often see strong initial demand, mature products stabilize, and declining products can become slow moving inventory.
Low Inventory Turnover: Causes, Risks & the Dead Stock Connection
Low turnover doesn’t always signal a problem, but consistently low turnover deserves attention. Common causes include overstocking, weak demand, poor demand forecasting, an oversized SKU catalog carrying low revenue products, and naturally long product lifecycles.
The risks compound over time. Dead stock (inventory unlikely to ever sell) consumes warehouse space while generating little or no revenue. Slow moving inventory increases carrying costs, ties up cash that could fund growth, and raises obsolescence risk, particularly in electronics, fashion, and seasonal categories. Many businesses respond with aggressive discounting to clear the backlog, which improves turnover on paper but cuts directly into profitability.
What causes a high ratio, by contrast? Usually strong demand, effective inventory planning, and efficient replenishment, but not always. Extremely high turnover can also mean understocking, so it’s worth evaluating turnover alongside stockout rates and inventory availability rather than reading a high number as automatically positive.
Limitations of the Inventory Turnover Ratio
Inventory turnover ratio is valuable, but it shouldn’t be used in isolation:
- It doesn’t measure profitability. A product can have strong turnover and thin margins at the same time.
- It can be distorted by seasonality. Highly seasonal businesses see large swings across the year.
- It doesn’t reveal stockouts. A high ratio can hide the fact that products were simply unavailable to sell.
- It relies on averaged inventory, which can mask operational issues the average smooths over.
- Benchmarks differ by industry. Comparing your ratio against an unrelated sector leads to inaccurate conclusions.
Inventory Turnover Ratio vs. Other Inventory Metrics
Turnover works best alongside other inventory performance metrics, not as a standalone scorecard.
| Metric |
What It Measures |
Direction |
| Inventory Turnover Ratio |
How many times inventory is sold in a period |
Higher is usually better |
| Days Sales of Inventory (DSI) |
How long inventory sits before selling |
Lower is usually better |
| Sell-Through Rate |
How much newly received inventory sells in a window |
Higher is usually better |
| GMROI |
Gross profit generated per dollar of inventory invested |
Higher is usually better |
Inventory turnover evaluates your entire inventory investment; sell-through rate zooms in on how new stock performs; GMROI adds the profitability dimension turnover alone can’t capture. Used together, they give a far more complete read on inventory health than any single ratio.
7 Proven Ways to Improve Inventory Turnover Ratio
Improving turnover takes a combination of better forecasting, tighter replenishment control, and real inventory visibility.
- Improve demand forecasting accuracy. Base purchasing on historical sales data, seasonal trends, promotional activity, and product lifecycle stage. Strong forecasting reduces both overstocking and stockouts at the same time.
- Tighten reorder points and supplier lead times. Review reorder points regularly and work with suppliers to shorten lead times, which improves how quickly you can respond to actual demand.
- Use dynamic pricing on slow moving inventory. Targeted markdowns and promotions move stagnant stock without resorting to broad, margin killing discounts.
- Bundle or cross-sell slow movers with popular products to reduce excess inventory while increasing average order value.
- Automate low stock alerts and reordering. Manual inventory monitoring breaks down as catalogs grow. Automation catches risk before stock levels become critical.
- Rationalize your SKU catalog. Not every SKU earns its shelf space; regularly review performance and retire products that aren’t contributing meaningful revenue.
- Synchronize inventory across every sales channel. For multichannel sellers on Amazon, Shopify, eBay, Walmart Marketplace, Etsy, and WooCommerce, unsynchronized inventory records quietly become inaccurate across every channel at once, which is also the fastest route to overselling and the stockouts that drag turnover down for the wrong reasons.
How Inventory Management Software Improves Inventory Turnover
Turnover improves when businesses can make faster, more accurate inventory decisions, which gets harder the moment inventory is spread across multiple channels, warehouses, suppliers, and fulfillment locations.
Real-time inventory visibility answers the basic questions that are otherwise hard to track at scale: which products are selling fastest, which SKUs are becoming dead stock, what needs replenishing, and what’s overstocked.
Inventory synchronization across sales channels keeps stock levels accurate everywhere at once, rather than relying on manual updates that drift out of sync the moment volume picks up, reducing overselling, stockouts, and discrepancies in the process. This matters even more for sellers running
multi-site or multi-warehouse inventory setups, where manual tracking breaks down fastest.
Inventory visibility becomes increasingly difficult as businesses add new sales channels, warehouses, and fulfillment partners. Accurate inventory synchronization helps ensure that purchasing decisions, inventory replenishment, and demand planning are based on current stock levels rather than outdated inventory records. This reduces the likelihood of stockouts, excess inventory, and costly inventory discrepancies.
Automated reorder points replace manual inventory reviews that stop scaling once a catalog grows past a handful of SKUs. Software sets thresholds, monitors them continuously, and triggers low stock alerts automatically.
Demand forecasting and inventory planning tools analyze historical sales trends, seasonal demand patterns, and inventory velocity to support more accurate purchasing decisions.
Inventory analytics and reporting extend beyond turnover alone, tracking DSI, sell-through rate, GMROI, inventory accuracy, and stockout rate together to catch problems before they get expensive.
Plan Smarter Inventory Turnover With StockKonnect
Inventory turnover doesn’t improve through guesswork. It improves when a business has accurate inventory data, consistent visibility, and reliable synchronization across every sales channel.
StockKonnect helps ecommerce businesses centralize inventory operations from a single platform, with:
For businesses selling through Amazon Seller Central, Shopify, eBay, Walmart Marketplace, Etsy, and WooCommerce, keeping inventory records accurate gets harder as operations scale. Instead of relying on spreadsheets and disconnected systems, StockKonnect gives you one centralized environment built to support that growth, reducing manual work while improving accuracy across every connected marketplace.
Explore StockKonnect’s Inventory Management Software →
Real-World Inventory Turnover Examples
Turnover ratios vary significantly by industry. These examples show how the same formula plays out differently across sectors.
Example 1, Apparel ecommerce: Annual COGS $900,000, Average Inventory $180,000. 900,000 ÷ 180,000 =
5. A turnover ratio of five generally indicates healthy movement for apparel while maintaining product availability.
Example 2, Grocery: Annual COGS $2,400,000, Average Inventory $200,000. 2,400,000 ÷ 200,000 =
12. Because grocery products are perishable and move quickly, higher turnover ratios like this are typical.
Example 3, Electronics: Annual COGS $1,500,000, Average Inventory $300,000. 1,500,000 ÷ 300,000 =
5. A ratio of five can indicate healthy performance depending on product category. Electronics sellers often balance availability against obsolescence risk.
Frequently Asked Questions
Why does inventory turnover matter?
Inventory turnover matters because it shows how efficiently a business converts inventory into revenue. A healthy ratio supports stronger cash flow, lower carrying costs, less dead stock, and better informed purchasing decisions, while a weak ratio is often an early warning sign of overstocking or slowing demand before it shows up elsewhere in the business.
How do you calculate inventory turnover ratio?
Divide Cost of Goods Sold (COGS) by Average Inventory, where Average Inventory is (Beginning Inventory + Ending Inventory) ÷ 2. The result shows how many times inventory was sold and replenished during the period measured, typically calculated annually, though many businesses also track it quarterly or monthly for tighter visibility.
What is a good inventory turnover ratio?
It depends on your industry. There’s no single “good” number. Many retail and ecommerce businesses target 4 to 8 turns per year, while grocery and perishable goods sellers often run 10 to 15 or higher. The most reliable benchmark is comparing your ratio against similar businesses in your own sector, not a generic average.
What is inventory turnover ratio?
Inventory turnover ratio measures how efficiently a business sells and replaces its inventory during a specific period, calculated as Cost of Goods Sold divided by Average Inventory. It’s one of the most widely used metrics for evaluating inventory efficiency, purchasing effectiveness, and overall inventory management performance.
What does inventory turnover ratio tell you?
It tells you how well inventory levels align with customer demand. A strong ratio suggests products are moving at a healthy pace and cash isn’t sitting idle in unsold stock; a weak ratio suggests inventory is accumulating faster than it’s selling, which can point to forecasting, pricing, or purchasing problems worth investigating.
Is there a formula for Days Inventory Outstanding?
Yes. Days Inventory Outstanding equals 365 divided by the inventory turnover ratio. The result estimates the average number of days inventory sits in stock before it sells. Businesses often track DIO alongside the turnover ratio itself, since the two metrics describe the same underlying inventory speed from two different angles.
How often should inventory turn over?
There’s no universal target. It depends on industry, product type, demand pattern, and business goals. Retail and ecommerce businesses commonly aim for 4 to 8 turns annually, while perishable or fast moving categories turn over far more often. The right frequency is whichever rate keeps inventory available without tying up excess cash.
What’s the difference between inventory turnover and “inventory turns”?
Functionally, none. Both terms describe the same concept: how many times inventory is sold and replenished over a given period. “Inventory turns” is simply the more casual, operations floor phrasing of the same metric that finance teams usually call the inventory turnover ratio.
Key Takeaways
- Inventory turnover ratio measures how efficiently inventory is sold and replenished, calculated as COGS ÷ Average Inventory.
- Healthy turnover supports stronger cash flow, profitability, and working capital management.
- Low turnover contributes to overstocking, dead stock, and rising inventory costs.
- “Good” turnover is industry specific. Compare against your own sector, not a universal number.
- Forecasting, reorder points, and channel wide inventory synchronization are the levers that move the ratio.
- Evaluate turnover alongside DSI, sell-through rate, and GMROI for a complete picture.
- Inventory management software improves visibility, tracking, and replenishment decisions at scale.
Final Thoughts
Inventory turnover ratio remains one of the most valuable metrics for evaluating inventory performance. It shows how effectively inventory converts into revenue while surfacing exactly where efficiency is being lost. For ecommerce businesses managing inventory across multiple marketplaces, turnover is closely tied to visibility, synchronization, and forecasting accuracy. Combine strong inventory planning practices with the
right inventory management software, and you reduce excess inventory, improve cash flow, and make better informed inventory decisions as you grow.